


Most fleets already measure driver performance.
There’s a score attached to each driver. It tracks speeding, braking, acceleration, idling. It gives managers a quick way to compare drivers and flag risk. It’s useful, and it’s widely adopted.
The issue is what that score has come to represent. In many fleets, it’s become the default definition of performance, when it’s really only a partial view.
Behaviour isn’t the same as performance
Driver scores are built around behaviour events. That gives a clear picture of how a vehicle is being driven in the moment.
What it doesn’t show clearly is what that behaviour leads to over time.
Fuel use, tyre wear, servicing cycles and vehicle downtime all sit outside the score. They’re usually tracked elsewhere, often in separate systems. So fleets can see behaviour, but not always the operational impact of that behaviour.
That’s where performance becomes harder to judge.
The link to cost is often missing
The practical problem is that drivers can have a solid score and still be contributing to higher fuel spend or faster vehicle wear. Another might trigger more events but not actually be driving the biggest cost issue in the fleet.
Without a clear link between behaviour and cost, it’s difficult to prioritise what needs to change. The data exists, but the connection isn’t always there.
Feedback still arrives too late
There’s also a timing issue.
In many fleets, performance is still reviewed after the fact. Reports are generated, scores are reviewed, conversations follow. By that point, the behaviour has already translated into cost.
Real-time coaching tools exist, but they’re not always fully embedded into day-to-day operations. That leaves fleets reacting to performance, rather than shaping it as it happens.

Data is still fragmented
Driver data rarely sits in isolation.
Fuel reporting, maintenance systems, route planning tools and downtime tracking all hold part of the picture. But they don’t always connect back to driver performance in a consistent way.
That fragmentation makes it harder to move from insight to action.
Grey fleet creates blind spots
Where grey fleet is involved, the picture becomes less consistent again.
Some drivers are measured closely, while others are only partially visible or not tracked at all. That makes it difficult to apply a single standard across safety, efficiency and risk.
Operations are moving ahead of scoring
At the same time, fleet operations are becoming more integrated.
Route planning tools are starting to factor in maintenance schedules, downtime and real-world constraints. Platforms are combining telematics with wider operational data. But driver performance data isn’t always feeding into those decisions yet.
In the next article, we look at what a more complete approach looks like.
Read more guidance in this series:
What effective driver performance management actually looks like
A practical playbook for improving driver performance
Join Better Fleet for best-practice planning that's proven through real-world case studies: Better Fleet Campaign

Similar Stories

Better Fleet: Design a fleet trial that proves value before rollout
Fleet pilots often produce positive results. That does not necessarily mean t...

Better Fleet: Make the business case survive the contract
One of the weaknesses in traditional fleet procurement: A supplier may delive...

Better Fleet: Decide what has to be true instead of relying on supplier promises
Fleet suppliers increasingly sell measurable outcomes rather than simply prod...
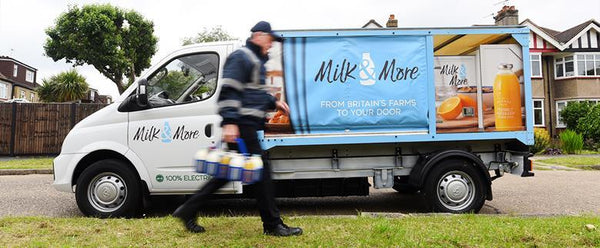
Success Stories: How Geotab telematics helped save Milk & More a cool £2m
The resulting fuel and energy savings provided a fast return on investment on...

Better Fleet: Futureproof EV policy by managing rules like an operating system
An EV policy written today will change as charging technology develops, vehic...

Better Fleet: EV adoption is creating policy debt, and exceptions are where it shows first
Most fleet policies were not designed around vehicles that refuel at an emplo...