


EVA England has published an updated Constituency Map revealing the areas where public charging rollout is keeping pace with rising EV adoption — and where it is falling behind. For fleets planning electrification routes, home-charger dependencies and driver support, the map provides one of the clearest regional snapshots yet of charging accessibility.
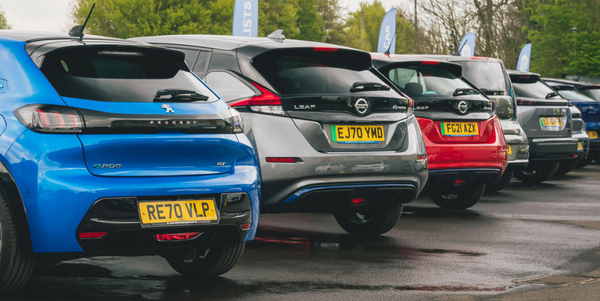
Developed with Field Dynamics and Zapmap, the dashboard maps EV uptake against the availability of slow, fast, rapid and ultra-rapid chargers in every constituency in England. With EVs now making up nearly a quarter of new car sales and more than 86,000 public charge points installed, EVA England says equitable access is now the single biggest determinant of EV uptake, particularly for the 40% of households without off-street parking.
The map highlights the top-performing areas for households without private charging:
Queen’s Park & Maida Vale, Peckham, Kensington & Bayswater, Islington South & Finsbury, and Hackney South & Shoreditch, where more than 99% of households are within a five-minute walk of a charger. Coventry and Brighton also lead progress outside London.
But the data also exposes constituencies where EV uptake remains below 2%, including Smethwick, West Bromwich, Plymouth Sutton & Devonport, Tipton & Wednesbury and Kingston upon Hull — signalling areas where fleets may face slower driver readiness and weaker charging provision.
EVA England CEO Vicky Edmonds said the tool “shines a light on the real-world experience of drivers… so policy and industry decisions are grounded in lived experience.”
Explore the full dashboard here: https://www.evaengland.org.uk/our-work/ev-constituency-dashboard/
Similar Stories
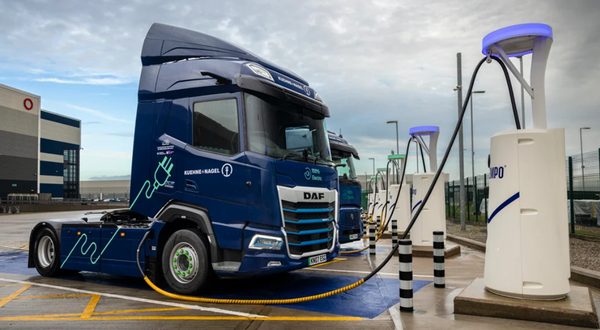
Coatbridge depot becomes Scotland's first megawatt truck-charging site
Scotland has switched on its first megawatt-scale charging facility for battery-electric lorries, at logistics operat...
Typical petrol driver spends annual EV charging costs in just five months
9 June is the point in the year where the average UK petrol driver will have spent more on fuel than an EV driver doe...
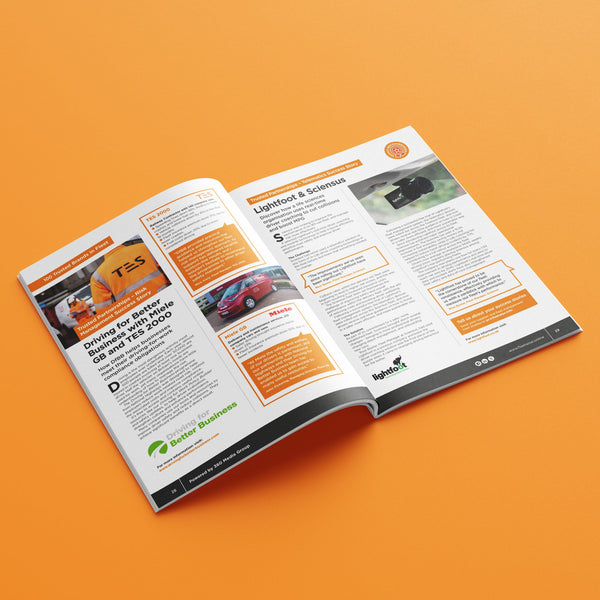
Trusted Brand: How one fleet cut collisions by 45%
Driving for Better Business continues to demonstrate the value of proactive fleet risk management through measurable ...
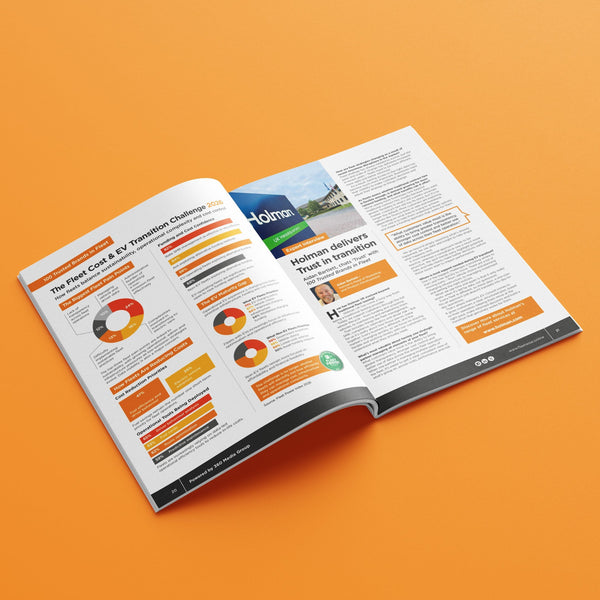
Aidan Bartlett, Holman: Why fleet partnerships are becoming more strategic
As fleet operations become more complex, businesses are looking for more than vehicle funding alone. Speaking to 100 ...

Five years that changed fleet management
The first edition of 100 Trusted Brands in Fleet launched in 2022, just as fleets were entering one of the most chall...

Soaring fuel costs have widened the gap between diesel and electric
The clearest money story right now is at the pump. Analysis from the Energy and Climate Intelligence Unit (ECIU), a t...

Used EV market turns a corner as values climb for first time in eight months
The used EV market is showing its firmest recovery in years, with three-year-old values rising 1...
Used EV leasing boom signals fleets are keeping vehicles for longer
New analysis from Licence Check suggests four and five-year replacement cycles are now becoming common, replacing the...

Fleets turn to shorter leases as businesses look to accelerate EV adoption
According to leasing specialist Liquid Fleet, demand is growing for six, 12 and 18-month agreements as employers resp...

Rural EV drivers could face bills three times higher under new road tax plans
Drivers in rural areas could pay more than three times as much as city motorists under the Government's proposed elec...

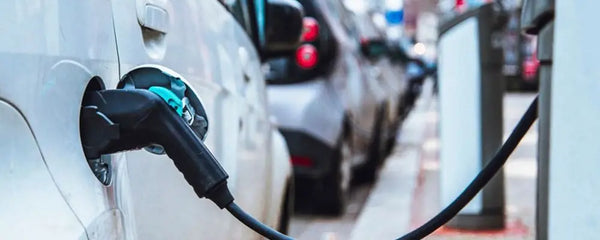
EV charging concerns continue to hold back drivers despite growing cost advantage
More UK drivers now believe electric vehicles are cheaper to run than petrol and diesel cars, but concerns about char...
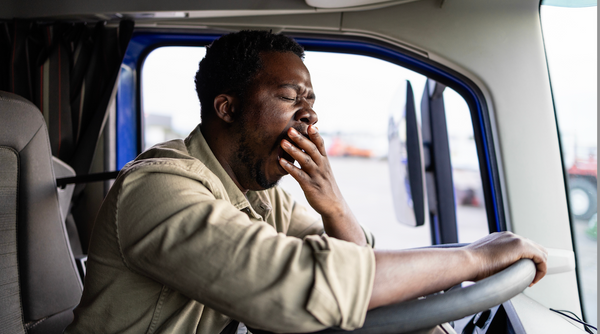
Driver fatigue may be linked to one in five crashes, fleets warned
Driver fatigue could be playing a role in up to one in five road collisions and around a quarter of fatal and serious...

Fleet data quality becomes critical as AI adoption grows, warns FleetCheck
Fleet operators looking to use artificial intelligence could end up making costly decisions if the data feeding those...

Kier cuts fleet collisions by 22% after overhauling driver risk programme
Kier Group has reduced road traffic collisions by 22% and cut driver non-compliance by 70% after introducing a more s...
In the market for an EV? These are the models impressing judges in 2026
Drivers weighing up their next electric or hybrid car have a fresh shortlist to consider after the EcoCar Electrified...
Better Fleet: A practical playbook for reducing fleet downtime
Here's seven considerations for understanding the true cost of downtime and reducing it where possible.
Better Fleet: What effective downtime management actually looks like
The fleets reducing downtime most successfully aren't necessarily repairing vehicles faster. They're becoming better ...
Better Fleet: Why fleet downtime remains a hidden business cost
Every fleet manager knows downtime is expensive. The problem is that most fleets only measure part of the cost. Repai...

AMAP increase gives grey fleet drivers boost as employers reassess mileage strategy
Grey fleet drivers will receive a significant increase in mileage reimbursement rates after the Government confirmed ...
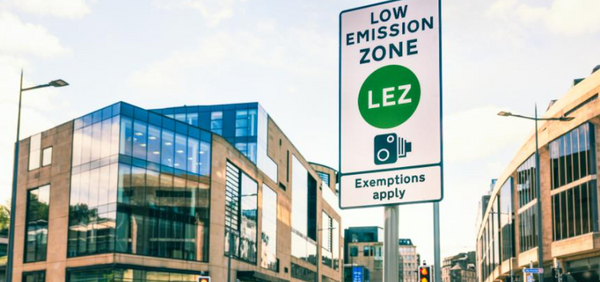
Clean air zone costs hit £250m as fleets turn to smarter compliance tools
Low-emission and clean air zones generated more than £250 million from UK drivers last year, with fleets increasingly...
Van downtime costs fleets £1,100 a day, meanwhile operators invest in uptime technology
UK businesses are losing more than £1,170 for every day a van is off the road, according to new research from Mercede...

Fleets urged to factor new EV tax plans into electrification strategy
British Vehicle Rental and Leasing Association is urging fleets to closely monitor proposed new EV taxation plans, wa...

MPs push for earlier ZEV mandate review as pressure grows on UK car makers
MPs are calling on the Government to bring forward its planned review of the UK’s ZEV mandate, warning that current r...
UK’s top insurance fraud hotspots revealed as fleets warned over rising scam claims
Fleet operators are being urged to raise driver awareness around insurance fraud after new analysis identified the UK...
Freshly launched shared charging model to cut e-truck costs by 10%, says Shell
Stagecoach and Shell have both launched new depot charging initiatives aimed at reducing one of the biggest barriers ...